As the US administration imposes new tariffs on steel and aluminium and considers further protectionist measures, we look at bilateral trade flows between the US and the EU28 across different types of products.
In light of the introduction of trade tariffs on steel and aluminium in the US, and the subsequent possibility of trade war between the EU and US, it is useful to identify the potential points of future contention.
The bubble chart below compares bilateral trade flows across the ten Standard International Trade Classification (SITC) macro categories of products. Bubbles are clustered by product, and their size is proportional to the value of the flow. Data are based on Eurostat Comext and refer to 2016.
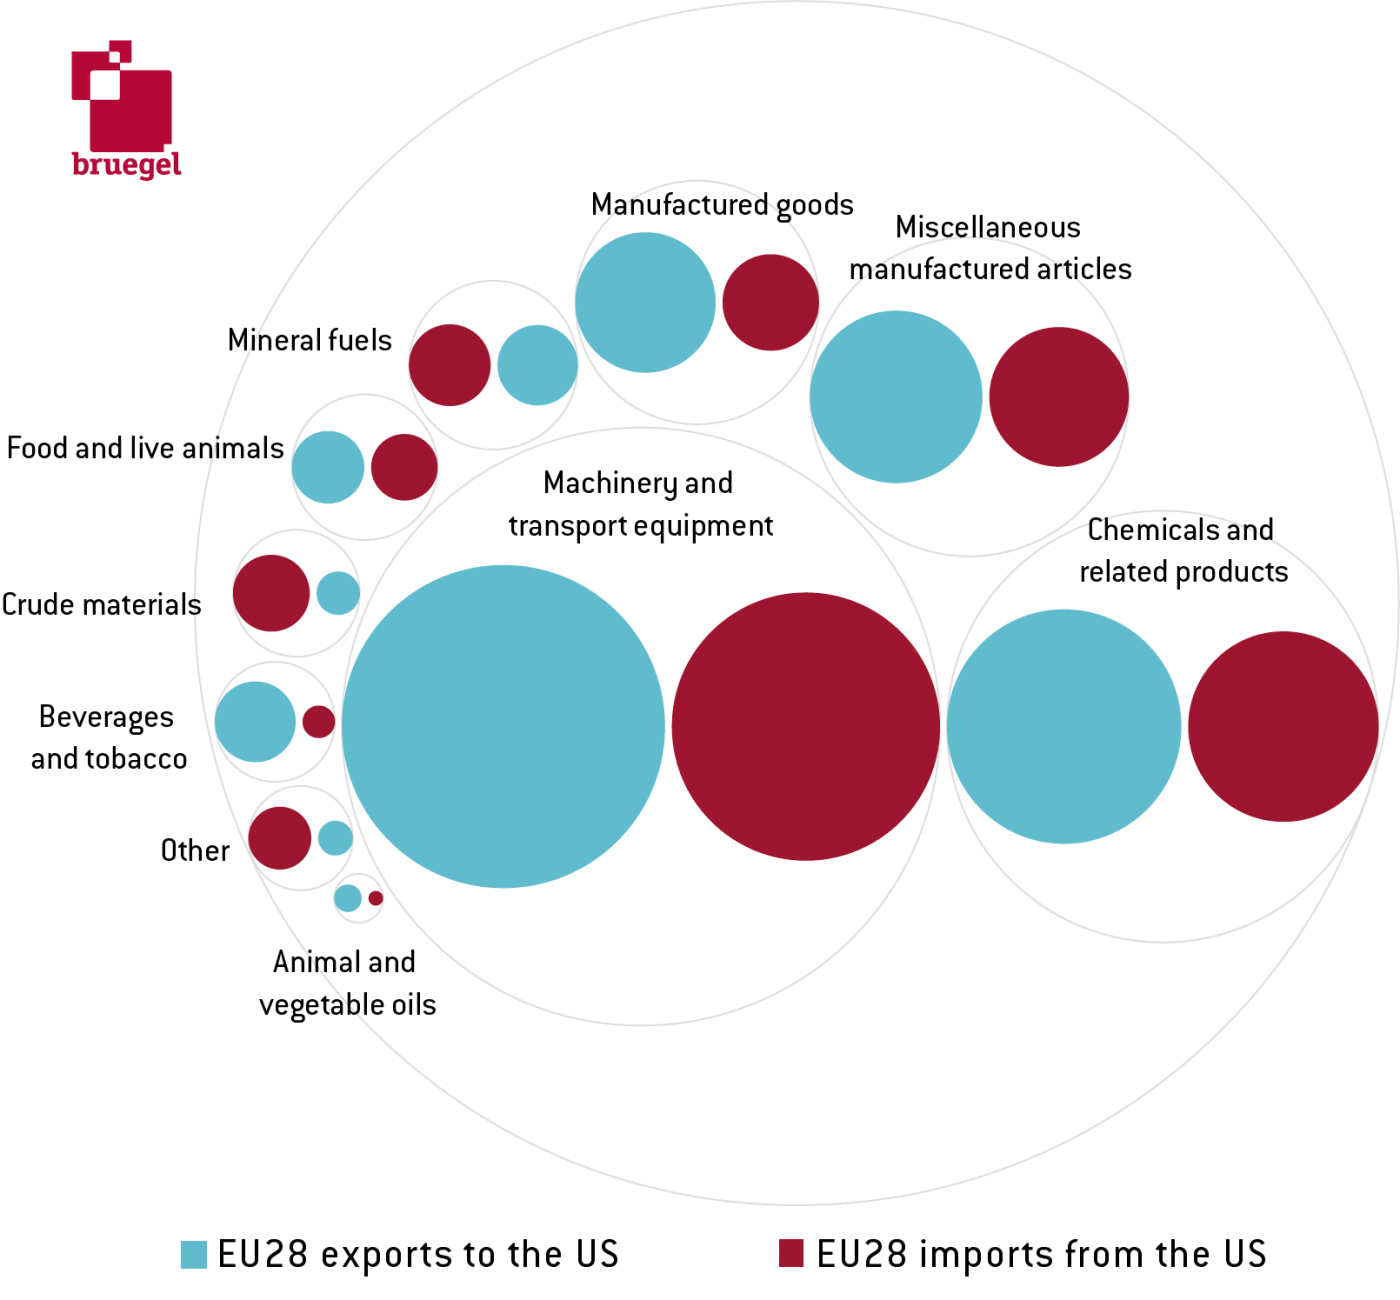
The EU28 runs a surplus in most product categories, with the exception of mineral fuels, crude materials and commodities not elsewhere specified (n.e.s.), and in particular for products in which the US and the EU28 trade intensively, like machinery and transport equipment (+�50.8 billion) and chemicals (+�29.3 billion).
Looking more in detail, the 10 most traded two-digit SITC products account for more than two thirds of all imports and exports between the US and the EU28. The two tables below summarise this information. With the exception of petroleum and related products (imported from the US) and specialised machinery (exported to the US), the same products are involved and it is interesting to look at major differences.
In general, the EU28 tends to export systematically more than it imports, especially in the case of road vehicles (+�36.5 billion), driven by massive EU28 exports of passenger cars to the US (+�30.4 billion), and of medicinal and pharmaceutical products (+�16.6 billion). On the other hand, the US exports more than it imports from the EU in the case of other transport equipment (-8.5 billion), mainly due to trade in aircraft, spacecraft, and associated equipment (-12.7 billion), as well as for power-generating machinery and equipment (-6.5 billion).
Particularly relevant may also be the trade in general industrial machinery and equipment, as well as in organic chemicals, because the EU28 exports to the US more than two times what it imports in those categories.


