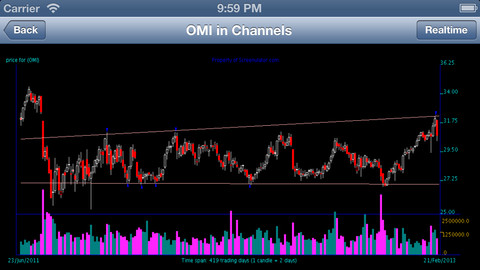
| 股票实时动态走势图apps for Android phone/tablet and iPhone |
| 送交者: 2013年04月24日06:07:20 于 [世界股票论坛] 发送悄悄话 |
|
|
|
手机下载股票实时动态走势图apps for Android phone/tablet and iPhone
Android: https://play.google.com/store/apps/details?id=screenulator.com.trendline.charts https://play.google.com/store/apps/details?id=screenulator.com.trendline.charts.pro
iPhone / iPads: https://itunes.apple.com/us/app/trendline-charts-free/id629280518?ls=1&mt=8 https://itunes.apple.com/us/app/trendline-charts-pro/id607887638?mt=8&uo=4
Trendline Charts is the only charting app to automatically display Support and Resistance lines (also known as Trendlines) on a Candlestick chart, powered by Screenulator.com chart pattern recognition engine. It also has a filter or stock screener based on Trendline patterns, such as Resistance breakout and Support penetration. For example, you can see all the stocks that have broke out resistance levels at a glance. About Trendlines: A trend line is a bounding line for the price movement of a security. A support trend line (or a bottom line) is formed when a securities price decreases and then rebounds at a pivot point that aligns with at least two previous support pivot points. Similarly a resistance trend line (or a top line) is formed when a securities price increases and then rebounds at a pivot point that aligns with at least two previous resistance pivot points. In other words, bottom lines are formed by joining a series of bottom points, and top lines are formed by joining a series of peaks.
Trendlines are considered by many expert traders and investors as the single most important tools in technical analysis. However, unlike other indicators of Technical Analysis, it does not come with a fixed formula, but require human eyes and brain to draw the best fit line across a series of bottoms or tops. It is still very much of an art form. If you are looking for a particular trendline pattern - such as Resistance breakout, the tasks of drawing trendlines for all stocks on the market becomes tedious if not impossible. This tool solves the problem for you.
The App lets user select any US stock by entering symbol or company name, and shows near real time quotes (synched with Yahoo finance), and draws beautiful candle stick charts with trendlines overlay. Charts can be viewed in many timeframes - from 3 months to 10 years or maximum lifespan of the stock. Trendline overlays are designed to help you find true trendlines, not the final answer. Some possible trendline candidates may not match your ideal shape, use your intuition to make the best trading decision. Stock screeners based on trendline patterns include: Resistance (topline) breakout, Support (bottom line) penetration, Channels (both top and bottom line), Wedge (Consolidation pattern bounded by top and bottom lines), near Support level, near Resistance level. The screening results are updated daily and individual stock charts and automatic trendline drawing is done instantaneously in real time. - Candlestick charting for all stocks traded in theUSmarket (10000 symbols), Canadian, Hong Kong, andAustralia. More countries will be added later! - Advanced chart pattern recognition engine to display trendlines overlay - Stock screeners based on trendline patterns, updated daily |
|
|
 |
 |
| 实用资讯 | |
|
|
| 一周点击热帖 | 更多>> |
| 一周回复热帖 |
| 历史上的今天:回复热帖 |
| 2012: | 牛顿为何拿不到诺贝尔奖?他那万有引力 | |
| 2012: | DNDN, buy as much as you can below 1 | |
| 2011: | 泡兄,记得你有妙计对应里面的问题。 | |
| 2011: | 看看政府新楼和鬼城 | |
| 2010: | 这个等待也许是很长时间 | |
| 2010: | 嘿嘿,这不是在说我吗? | |
| 2009: | 好戏必定在青年节前后 | |
| 2009: | 俺就做两件事,找出股市的顶和底。其他 | |

