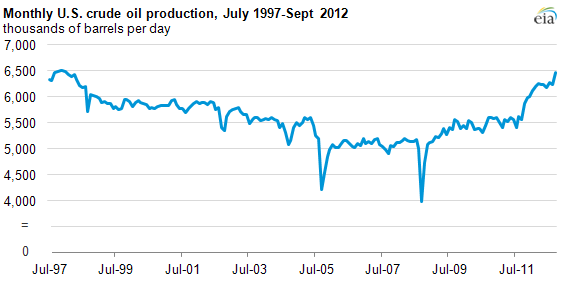
U.S. crude oil production (including lease condensate) averaged almost 6.5 million barrels per day in September 2012, the highest volume in nearly 15 years. The last time the United States produced 6.5 million barrels per day or more of crude oil was in January 1998. Since September 2011, U.S. production has increased by more than 900,000 barrels per day. Most of that increase is due to production from oil-bearing rocks with very low permeability through the use of horizontal drilling combined with hydraulic fracturing. The states with the largest increases are Texas and North Dakota.
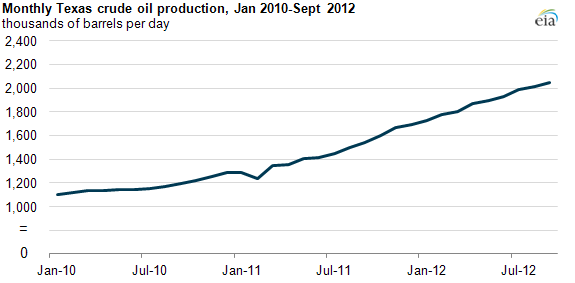
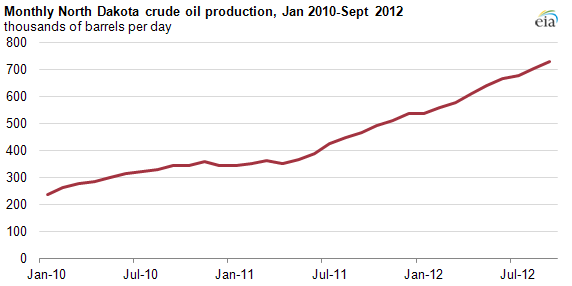
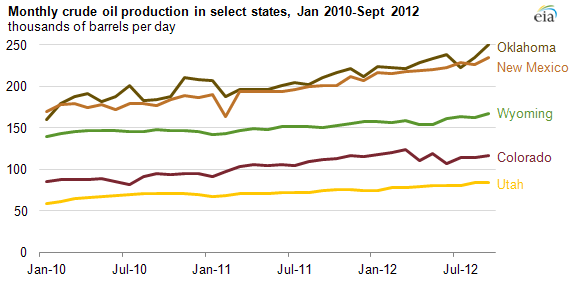
From September 2011 to September 2012, Texas production increased by more than 500,000 barrels per day, and North Dakota production increased by more than 250,000 barrels per day. Texas's increase in production is largely from the Eagle Ford formation in South Texas and the Permian Basin in West Texas. North Dakota's increase in oil production comes from the Bakken formation in the Williston Basin. Increased production from smaller-volume producing states, such as Oklahoma, New Mexico, Wyoming, Colorado, and Utah, is also contributing to the rise in domestic crude oil production.
Source: U.S. Energy Information Administration,


