今天老道的CLNT涨了不少。盈余比去年同期涨一倍。
UNG快要走过2-3年的U型大底了,预期到2015年,成本低容易挖的页岩气会被采光,天然气价格就会涨了。估计会在冬天上涨。
Market Trends — Natural Gas
Industrial and electric power sectors lead U.S. growth in natural gas consumption
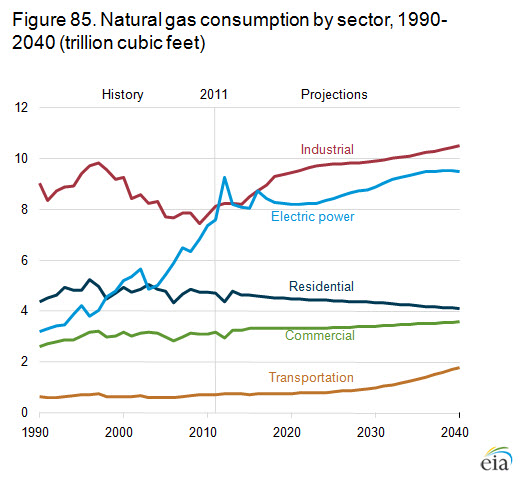
figure data U.S. total natural gas consumption grows from 24.4 trillion cubic feet in 2011 to 29.5 trillion cubic feet in 2040 in the AEO2013 Reference case. Natural gas use increases in all the end-use sectors except residential (Figure 85), where consumption declines as a result of improvements in appliance efficiency and falling demand for space heating, attributable in part to population shifts to warmer regions of the country.
Despite falling early in the projection period from a spike in 2012, which resulted from very low natural gas prices relative to coal, consumption of natural gas for power generation increases by an average of 0.8 percent per year, with more natural gas used for electricity production as relatively low prices make natural gas more competitive with coal. Over the projection period, the natural gas share of total power generation grows, while the coal share declines.
Natural gas consumption in the industrial sector increases by an average of 0.5 percent per year from 2011 to 2040. This includes 0.7 trillion cubic feet of natural gas used in GTL, which is largely consumed in the transportation sector. Industrial output grows as the energy-intensive industries take advantage of relatively low natural gas prices, particularly through 2025. After 2025, growth in the sector slows in response to rising prices and increased international competition.
Although vehicle uses currently account for only a small part of total U.S. natural gas consumption, the projected percentage growth in natural gas demand by vehicles is the largest percentage growth in the projection. With incentives and low natural gas prices leading to increased demand for natural gas as a fuel for HDVs, particularly after 2025, consumption in vehicles increases from about 40 billion cubic feet in 2011 to just over 1 trillion cubic feet in 2040.
Natural gas prices rise with an expected increase in production costs after 2015
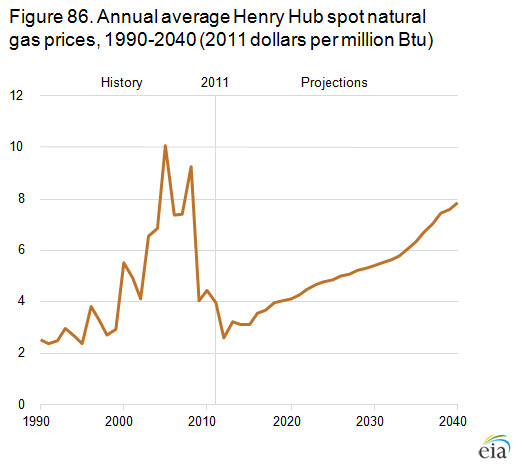
figure data U.S. natural gas prices have remained relatively low over the past several years as a result of abundant domestic supply and efficient methods of production. However, the cost of developing new incremental production needed to support continued growth in natural gas consumption and exports rises gradually in the AEO2013 Reference case, leading to an increase in the Henry Hub spot price. Henry Hub spot prices for natural gas increase by an average of about 2.4 percent per year, to $7.83 per million Btu (2011 dollars) in 2040 (Figure 86).
As of January 1, 2011, total proved and unproved U.S. natural gas resources (total recoverable resources) were estimated to total 2,327 trillion cubic feet. Over time, however, the depletion of resources in inexpensive areas leads producers to basins where recovery of the gas is more difficult and more expensive, causing the cost of production to rise gradually.
In the Reference case, natural gas prices remain low at the beginning of the projection period, as producers continue to extract natural gas resources from the most productive and inexpensive areas. Drilling activity remains robust despite the relatively low prices (below $4 per million Btu), particularly as producers extract natural gas from areas with high contents of NGL or oil. Prices begin to rise after 2015, and they continue rising in the projection through 2040.
Energy from natural gas remains far less expensive than energy from oil through 2040
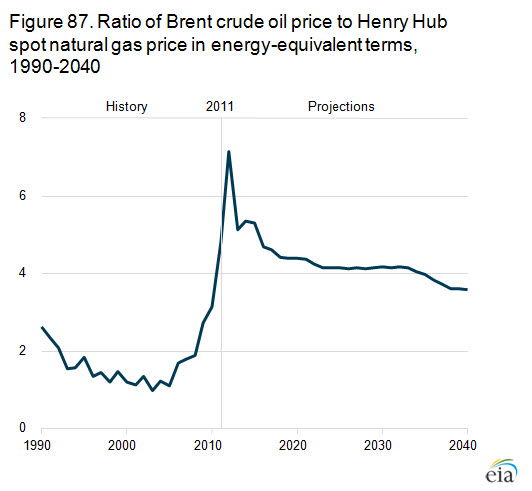
figure data The ratio of oil prices to natural gas prices is defined in terms of the Brent crude oil price and the Henry Hub spot natural gas price on an energy-equivalent basis. U.S. natural gas prices are determined largely on a regional basis, in response to supply and demand conditions in North America. Oil prices are more responsive to global supply and demand. A 1:1 ratio indicates that crude oil and natural gas cost the same in terms of energy content. On that basis, crude oil remains far more expensive than natural gas through 2040 (Figure 87), but the difference in the costs of the two fuels narrows over time.
With rising demand and production costs, both crude oil and natural gas prices increase through 2040; however, the oil price rises more slowly than the natural gas price, bringing the oil-to-gas price ratio down from its 2012 level. Low natural gas prices, the result of abundant domestic supply and weak winter demand, combined with high oil prices, caused a sharp rise in the oil-to-gas price ratio in 2012.
Natural gas prices nearly double in the AEO2013 Reference case, from $3.98 per million Btu in 2011 to $7.83 in 2040 (2011 dollars), and oil prices increase by about 50 percent, to $28.05 per million Btu in 2040. Over the entire period, the ratio remains well above the levels of the two previous decades. Oil and natural gas prices were more strongly aligned until about 2006, and the ratio of oil prices to natural gas prices was lower. Since 2006, however, natural gas prices have fallen as a result of abundant domestic supplies and production. In contrast, oil prices have increased and remained relatively high as global demand has increased over the past several years.
Natural gas prices depend on economic growth and resource recovery rates among other factors
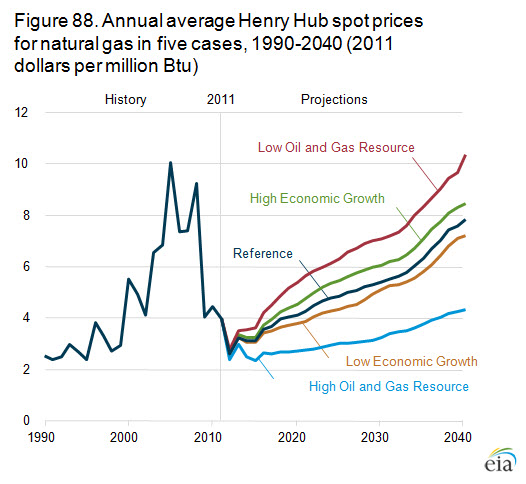
figure data Future levels of natural gas prices depend on many factors, including macroeconomic growth rates and expected rates of resource recovery from natural gas wells. Higher rates of economic growth lead to increased consumption of natural gas (primarily in response to higher levels of housing starts, commercial floorspace, and industrial output), causing more rapid depletion of natural gas resources and a more rapid increase in the cost of developing new production, which push natural gas prices higher. The converse is true in the Low Economic Growth case (Figure 88).
A lower rate of recovery from oil and gas wells implies higher costs per unit and higher prices. A higher rate of recovery implies lower costs per unit and lower prices. In comparison with the Reference case, the Low Oil and Gas Resource case assumes lower estimated ultimate recovery (EUR) from each shale well or tight well. The High Oil and Gas Resource case represents a more extreme case, with higher estimates for recoverable crude oil and natural gas resources in tight wells and shale formations and for offshore resources in the lower 48 states and Alaska.
In both cases, there are mitigating effects that dampen the initial price response from the demand or supply shift. For example, lower natural gas prices lead to an increase in natural gas exports, which places some upward pressure on natural gas prices. In addition, lower prices are likely to lead to less drilling for natural gas and lower production potential, placing some upward pressure on natural gas prices.
With production outpacing consumption, U.S. exports of natural gas exceed imports
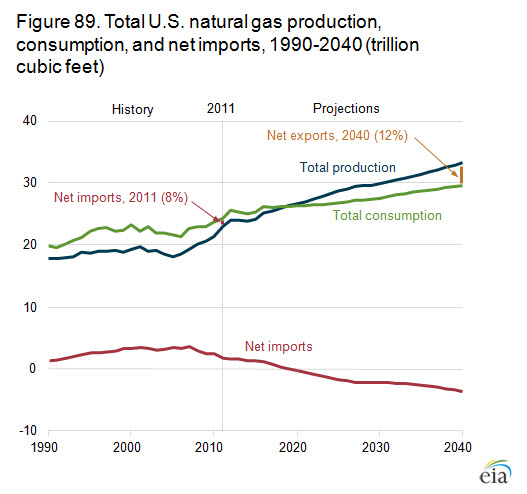
figure data The United States consumed more natural gas than it produced in 2011, with net imports of almost 2 trillion cubic feet. As domestic supply has increased, however, natural gas prices have declined, making the United States a less attractive market and reducing U.S. imports. Conversely, lower prices have made purchases of U.S. natural gas more attractive, increasing exports. In the AEO2013 Reference case, the United States becomes a net exporter of natural gas by 2020 (Figure 89).
Production growth, led by increased development of shale gas resources, outpaces consumption growth in the Reference case—a pattern that continues through 2040. As a result, exports continue to grow at a rate of about 17.7 percent per year from 2020 to 2040. Net exports in 2020 are less than 1 percent of total consumption; in 2040 they are 12 percent of consumption.
U.S. natural gas production increases by about 1 percent per year from 2011 to 2040 in the Reference case, meeting domestic demand while also allowing for more exports. The prospects for future exports are highly uncertain, however, depending on many factors that are difficult to anticipate, such as the development of new production capacity in foreign countries, particularly from deepwater reservoirs, shale gas deposits, and the Arctic.
U.S. natural gas production is affected by oil prices through consumption and exports
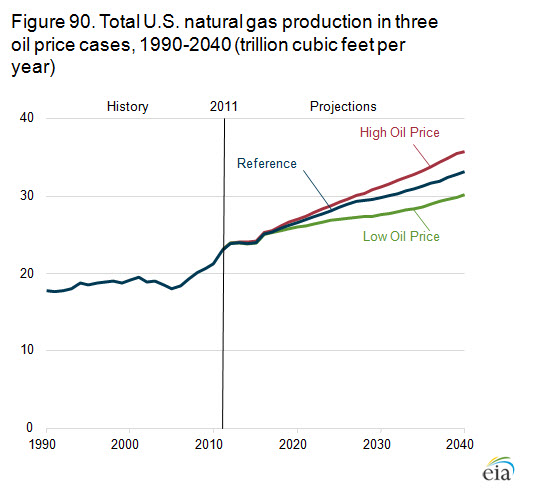
figure data U.S. natural gas production is affected by crude oil prices primarily through changes in natural gas consumption and exports. Across the AEO2013 oil price cases, the largest changes in natural gas use occur in natural gas converted into liquid fuels via GTL, directly consumed in transportation as CNG or LNG, and exported as LNG. Because world LNG prices are directly affected by crude oil prices, depending on regional market conditions, crude oil prices are important to the market value of LNG exported from the United States.
The profitability of using natural gas as a transportation fuel, or for exporting LNG, depends largely on the price differential between crude oil and natural gas. The greater the difference between crude oil and natural gas prices, the greater the incentive to use natural gas. For example, in the Low Oil Price case, average oil prices are about $7.80 per million Btu higher than natural gas prices from 2012 through 2040—a relatively low price differential that leads to virtually no use of natural gas for transportation and very little for LNG exports. In the High Oil Price case, the average price difference is about $24.30 per million Btu from 2012 through 2040, providing the incentives necessary to promote natural gas use in transportation applications and for export.
Across the price cases, total natural gas production varies by 5.6 trillion cubic feet in 2040 (Figure 90). Changes in LNG exports account for 3.6 trillion cubic feet of the difference. Direct consumption of natural gas for transportation varies by 2.1 trillion cubic feet between the two cases, and consumption for GTL production varies by 1.1 trillion cubic feet. Across the price cases, as natural gas production rises, so do natural gas prices; and as natural gas prices rise, consumption in the other end-use sectors falls by as much as 2.5 trillion cubic feet.
Shale gas provides the largest source of growth in U.S. natural gas supply
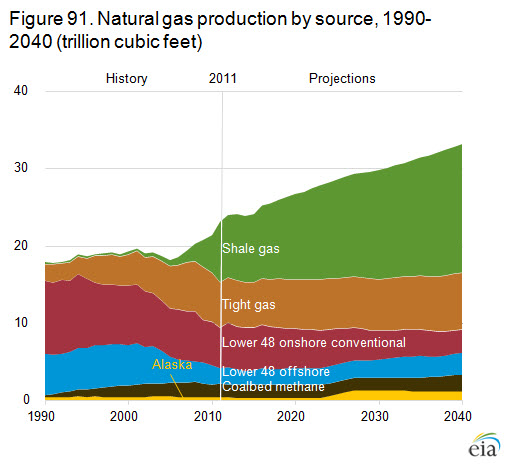
figure data The 44-percent increase in total natural gas production from 2011 through 2040 in the AEO2013 Reference case results from the increased development of shale gas, tight gas, and coalbed methane resources (Figure 91). Shale gas production, which grows by 113 percent from 2011 to 2040, is the greatest contributor to natural gas production growth. Its share of total production increases from 34 percent in 2011 to 50 percent in 2040. Tight gas and coalbed methane production also increase, by 25 percent and 24 percent, respectively, from 2011 to 2040, even as their shares of total production decline slightly. The growth in coalbed methane production is not realized until after 2035, when natural gas prices and demand levels are high enough to spur more drilling.
Offshore natural gas production declines by 0.3 trillion cubic feet from 2011 through 2014, as offshore exploration and development activities are directed toward oil-prone areas in the Gulf of Mexico. After 2014, offshore natural gas production recovers as prices rise, growing to 2.8 trillion cubic feet in 2040. As a result, from 2011 to 2040, offshore natural gas production increases by 35 percent.
Alaska natural gas production also increases in the Reference case with the advent of Alaska LNG` exports to overseas customers beginning in 2024 and growing to 0.8 trillion cubic feet per year (2.2 billion cubic feet per day) in 2027. In 2040, Alaska natural gas production totals 1.2 trillion cubic feet.
Although total U.S. natural gas production rises throughout the projection, onshore nonassociated conventional production declines from 3.6 trillion cubic feet in 2011 to 1.9 trillion cubic feet in 2040, when it accounts for only about 6 percent of total domestic production, down from 16 percent in 2011.
Pipeline exports increase as Canadian imports fall and exports to Mexico rise
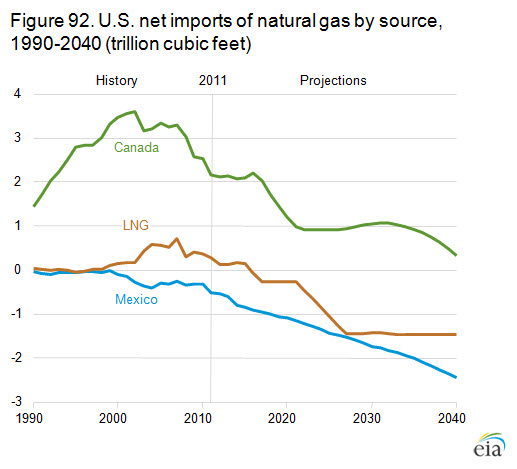
figure data With relatively low natural gas prices in the AEO2013 Reference case, the United States becomes a net exporter of natural gas in 2020, and net exports grow to 3.6 trillion cubic feet in 2040 (Figure 92). Most of the projected growth in U.S. exports consists of pipeline exports to Mexico, which increase steadily over the projection period, as increasing volumes of imported natural gas from the United States fill the growing gap between Mexico's production and consumption. Exports to Mexico increase from 0.5 trillion cubic feet in 2011 to 2.4 trillion cubic feet in 2040.
U.S. exports of domestically sourced LNG (excluding existing exports from the Kenai facility in Alaska, which fall to zero in 2013) begin in 2016 and rise to a level of 1.6 trillion cubic feet per year in 2027. One-half of the projected increase in U.S. exports of LNG originate in the Lower 48 states and the other half from Alaska. Continued low levels of LNG imports through the projection period position the United States as a net exporter of LNG by 2016. In general, future U.S. exports of LNG depend on a number of factors that are difficult to anticipate, including the speed and extent of price convergence in global natural gas markets, the extent to which natural gas competes with oil in domestic and international markets, and the pace of natural gas supply growth outside the United States.
Net natural gas imports from Canada decline sharply from 2016 to 2022, then stabilize somewhat before dropping off again in the final years of the projection, as continued growth in domestic production mitigates the need for imports. Even as overall consumption exceeds supply in the United States, some natural gas imports from Canada continue, based on regional supply and demand conditions.


