| 这篇文章说WLI和股市同步,对股市短期预测不是太有用 |
| 送交者: good sniper 2010月09月20日22:17:23 于 [世界股票论坛] 发送悄悄话 |
| 回 答: 老道担心盈余季节反映出前面的经济疲软,但不担心WLIG二波跌 由 道友 于 2010-09-20 21:27:51 |
|
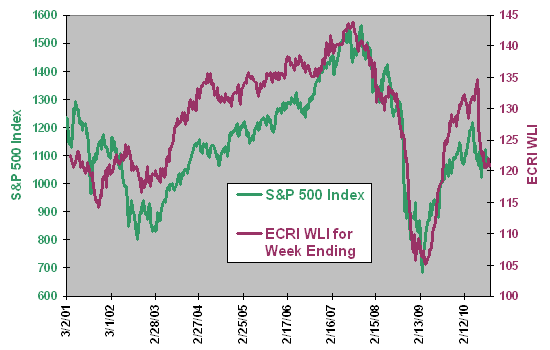
Financial market experts sometimes cite the Economic Cycle Research Institute’s (ECRI) Weekly Leading Index (WLI) as an important economic indicator, implying that it is somehow predictive of future stock market performance. According to ECRI, WLI “has an average lead of 10 months at business cycle peaks and three months at business cycle troughs…” with the most recent value summarizing any shift in overall outlook as a result of “data through the previous week.” We collect WLI data from various public web sources, such as DismalScientist. Note that ECRI releases a preliminary (revised) WLI with a one-week (two-week) lag. Does this indicator usefully foretell the future of equities? Using WLI readings for 3/2/01 to 8/20/10 (500 weeks) and contemporaneous weekly S&P 500 Index data, we find that: The following chart depicts the behaviors of the S&P 500 Index and WLI over the entire sample period. The shapes are generally similar, but the degree to which WLI leads or lags the stock market is not obvious. Because stock market behavior is an input to the WLI, the two series should display some similarity. Does the alternative visualization of a scatter plot reveal more about the relationship between WLI and stocks?
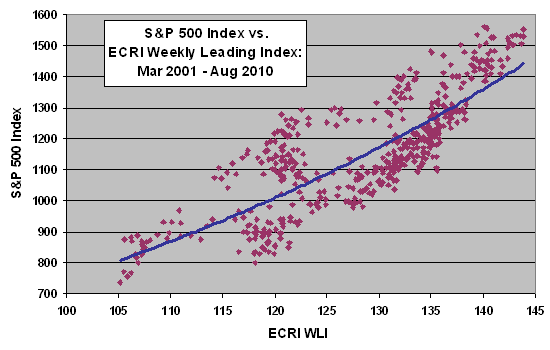
The following scatter plot relates the S&P 500 Index to WLI over the entire sample period, with an exponential best-fit curve. The data indicate that the two series generally move up and down together. However, clustering of data suggests that the relationship sometimes changes (switches regimes). Where might the regimes be within the sample period?
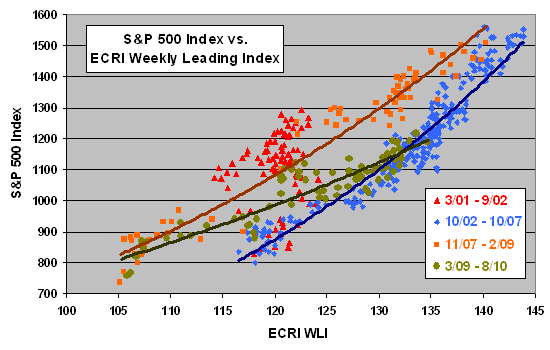
The next scatter plot breaks the stocks-WLI relationship into four regimes: (1) the declining stock market of 3/01-9/02; (2) the advancing stock market of 10/02-10/07; (3) the declining stock market of 11/07-2/09; and, (4) the advancing stock market of 3/09-8/10. There is a positive relationship between the stock market and WLI during both bull and bear regimes, but bull regimes appears to be more conservative (lower stock price for a given level of leading indicators). Possible explanations are:
The number of data points on this plot and the prior one likely overstates reliability of any inferences, because some inputs to WLI probably do not vary weekly. For a more sensitive view of the relationship between WLI and stocks, we compare weekly changes.
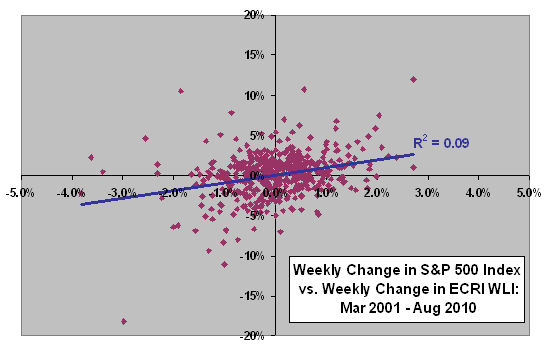
The next scatter plot relates weekly change in the S&P 500 Index during the week before WLI release to change in WLI across the entire sample period. The Pearson correlation between these two series is 0.30, and the R-squared statistic is 0.09, confirming that WLI and stocks tend to move in the same direction and suggesting that weekly changes in WLI explain 9% of the variation in contemporaneous stock market behavior. But does WLI lead the stock market, or vice versa?
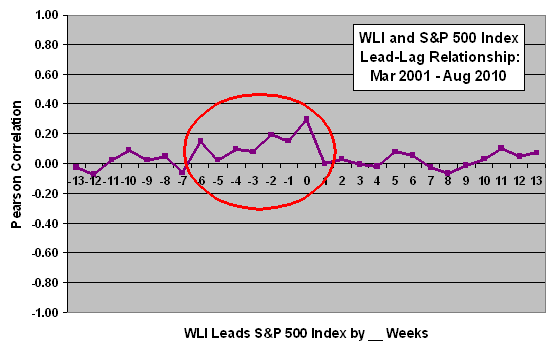
The next chart shows the Pearson correlations for various WLI-stocks lead-lag relationships, ranging from stocks lead WLI by 13 weeks (-13) to WLI leads stocks by 13 weeks (13). As noted above, the coincident correlation (0 weeks lead-lag) between weekly changes in WLI and weekly changes in the S&P 500 Index is 0.30. There is some indication that stocks may lead WLI by a few weeks, but these indications are all weaker than the coincident correlation. There is no evidence that WLI leads stocks, especially given that ECRI releases WLI preliminary/revised readings with one-week/two-week lags.
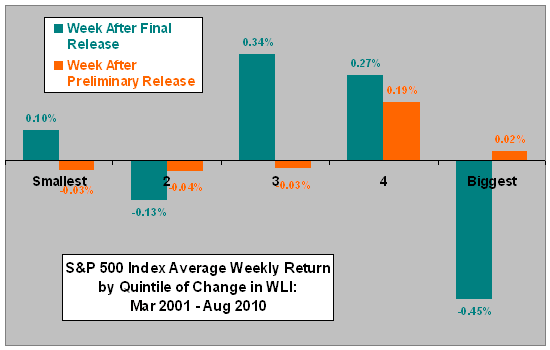
To test whether WLI exhibits any cumulative and exploitable predictive power for stocks, we relate weekly change in WLI (as revised) to the change in the S&P 500 Index from initial release to four weeks later, from initial release to 13 weeks later and from initial release to 26 weeks later. The Pearson correlations for these three relationships are 0.05, 0.09 and 0.08, respectively. These relationships are all small but positive, possibly indicative of some momentum. In contrast, the correlation between the weekly change in WLI and the change in the S&P 500 Index during the four weeks prior to WLI release is 0.37, again suggesting that WLI lags rather than leads the stock market. Might there be some non-linearity in the WLI-stocks relationship that yields useful prediction of stock returns? The final chart summarizes average weekly S&P 500 Index returns by quintile of change in WLI after both preliminary and final release weeks (assuming revisions in WLI are not material). Lack of any patterns across the range of smallest (most negative) to largest (most positive) changes in WLI again suggest no useful predictive power for stock returns.
In summary, evidence from simple tests suggest that ECRI WLI movements coincide with or slightly trail stock market behavior, offering little or no short-term trading intelligence. |
|
|
 |
||
|
 |
| 实用资讯 | |

